The Art of Data Journalism
Become a news nerd, interactively
Want to work data into your journalism? This collection of interactive tutorials covers the essential skills and concepts.
From basic data analysis to creating compelling visualizations, these lessons will help you:
- Master key tools like R, ggplot2, and Datawrapper
- Learn data cleaning, joining, and aggregation techniques
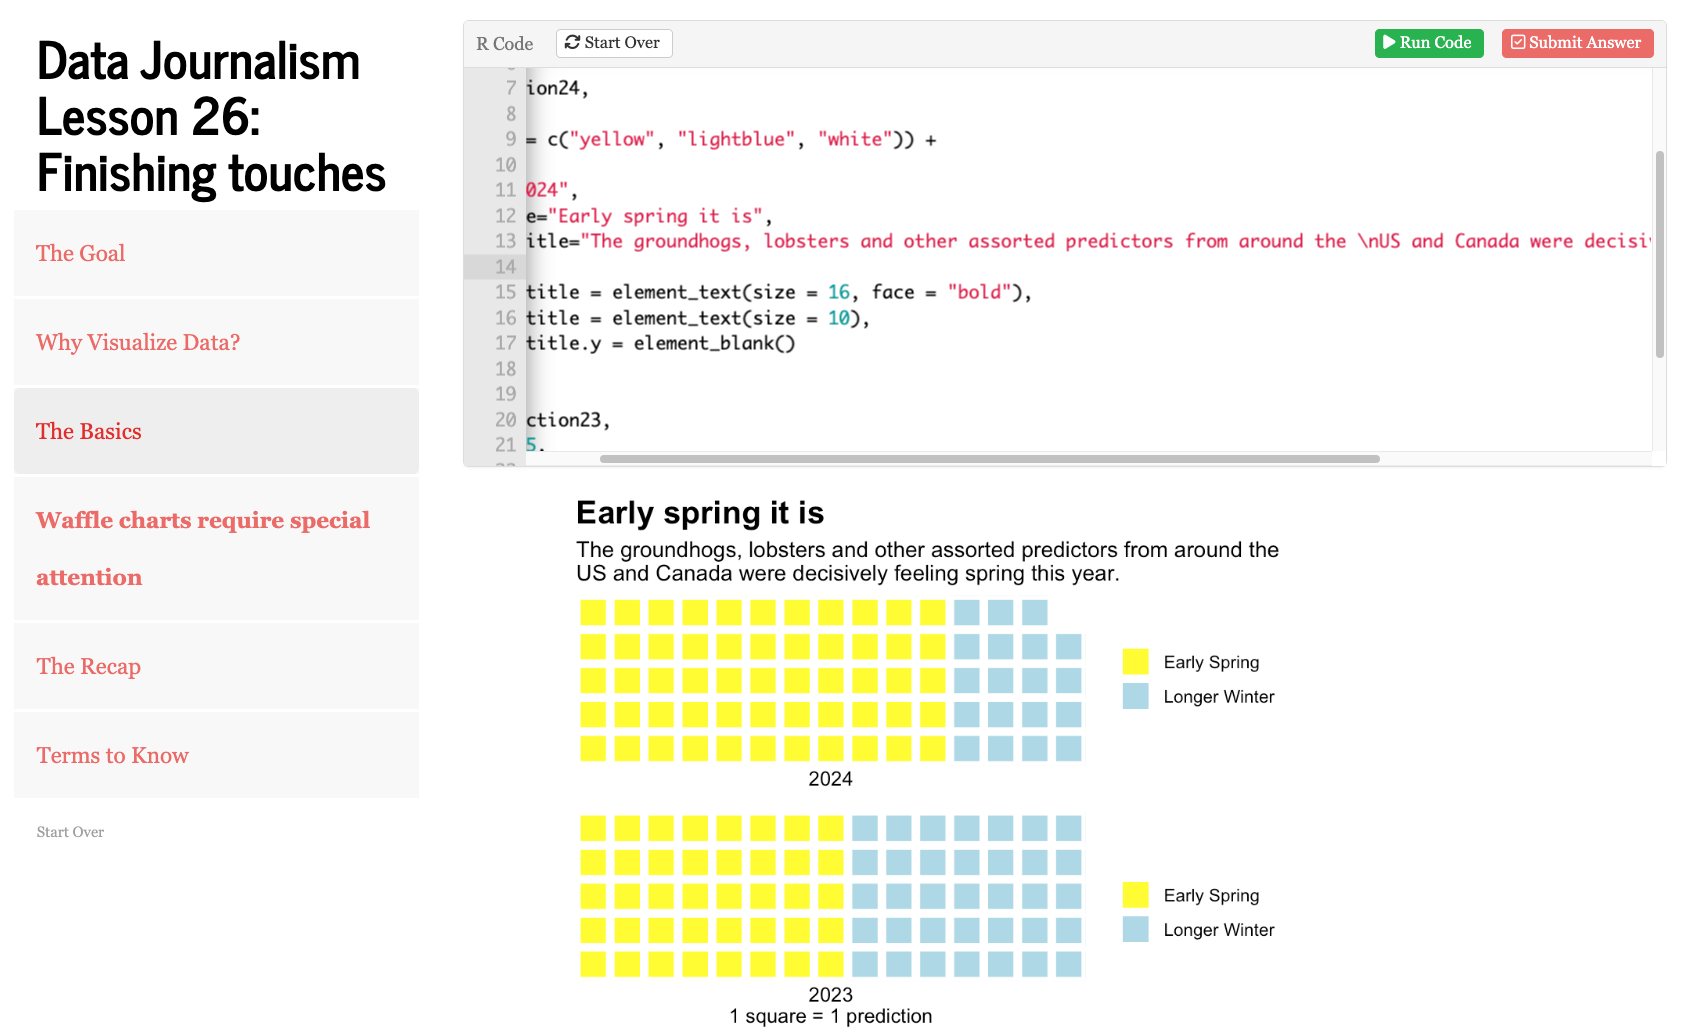
- Create professional charts, maps, and other visualizations
- Effectively communicate data-driven stories
Whether you’re a journalism student or working professional looking to expand your skillset, these hands-on tutorials will give you the practical knowledge to find and tell impactful stories with data.
What you need
Everything you need is free. Follow the complete installation instructions to get R, R Studio, LearnR and the tutorials installed on your machine.
From there, you’ll need to add a couple of bits about you to take advantage of features of the tutorials. Add what state you live in and the tutorials will rewrite themselves to highlight trends where you live using data from your state. Nothing makes learning better than caring about the outcome.
About the author
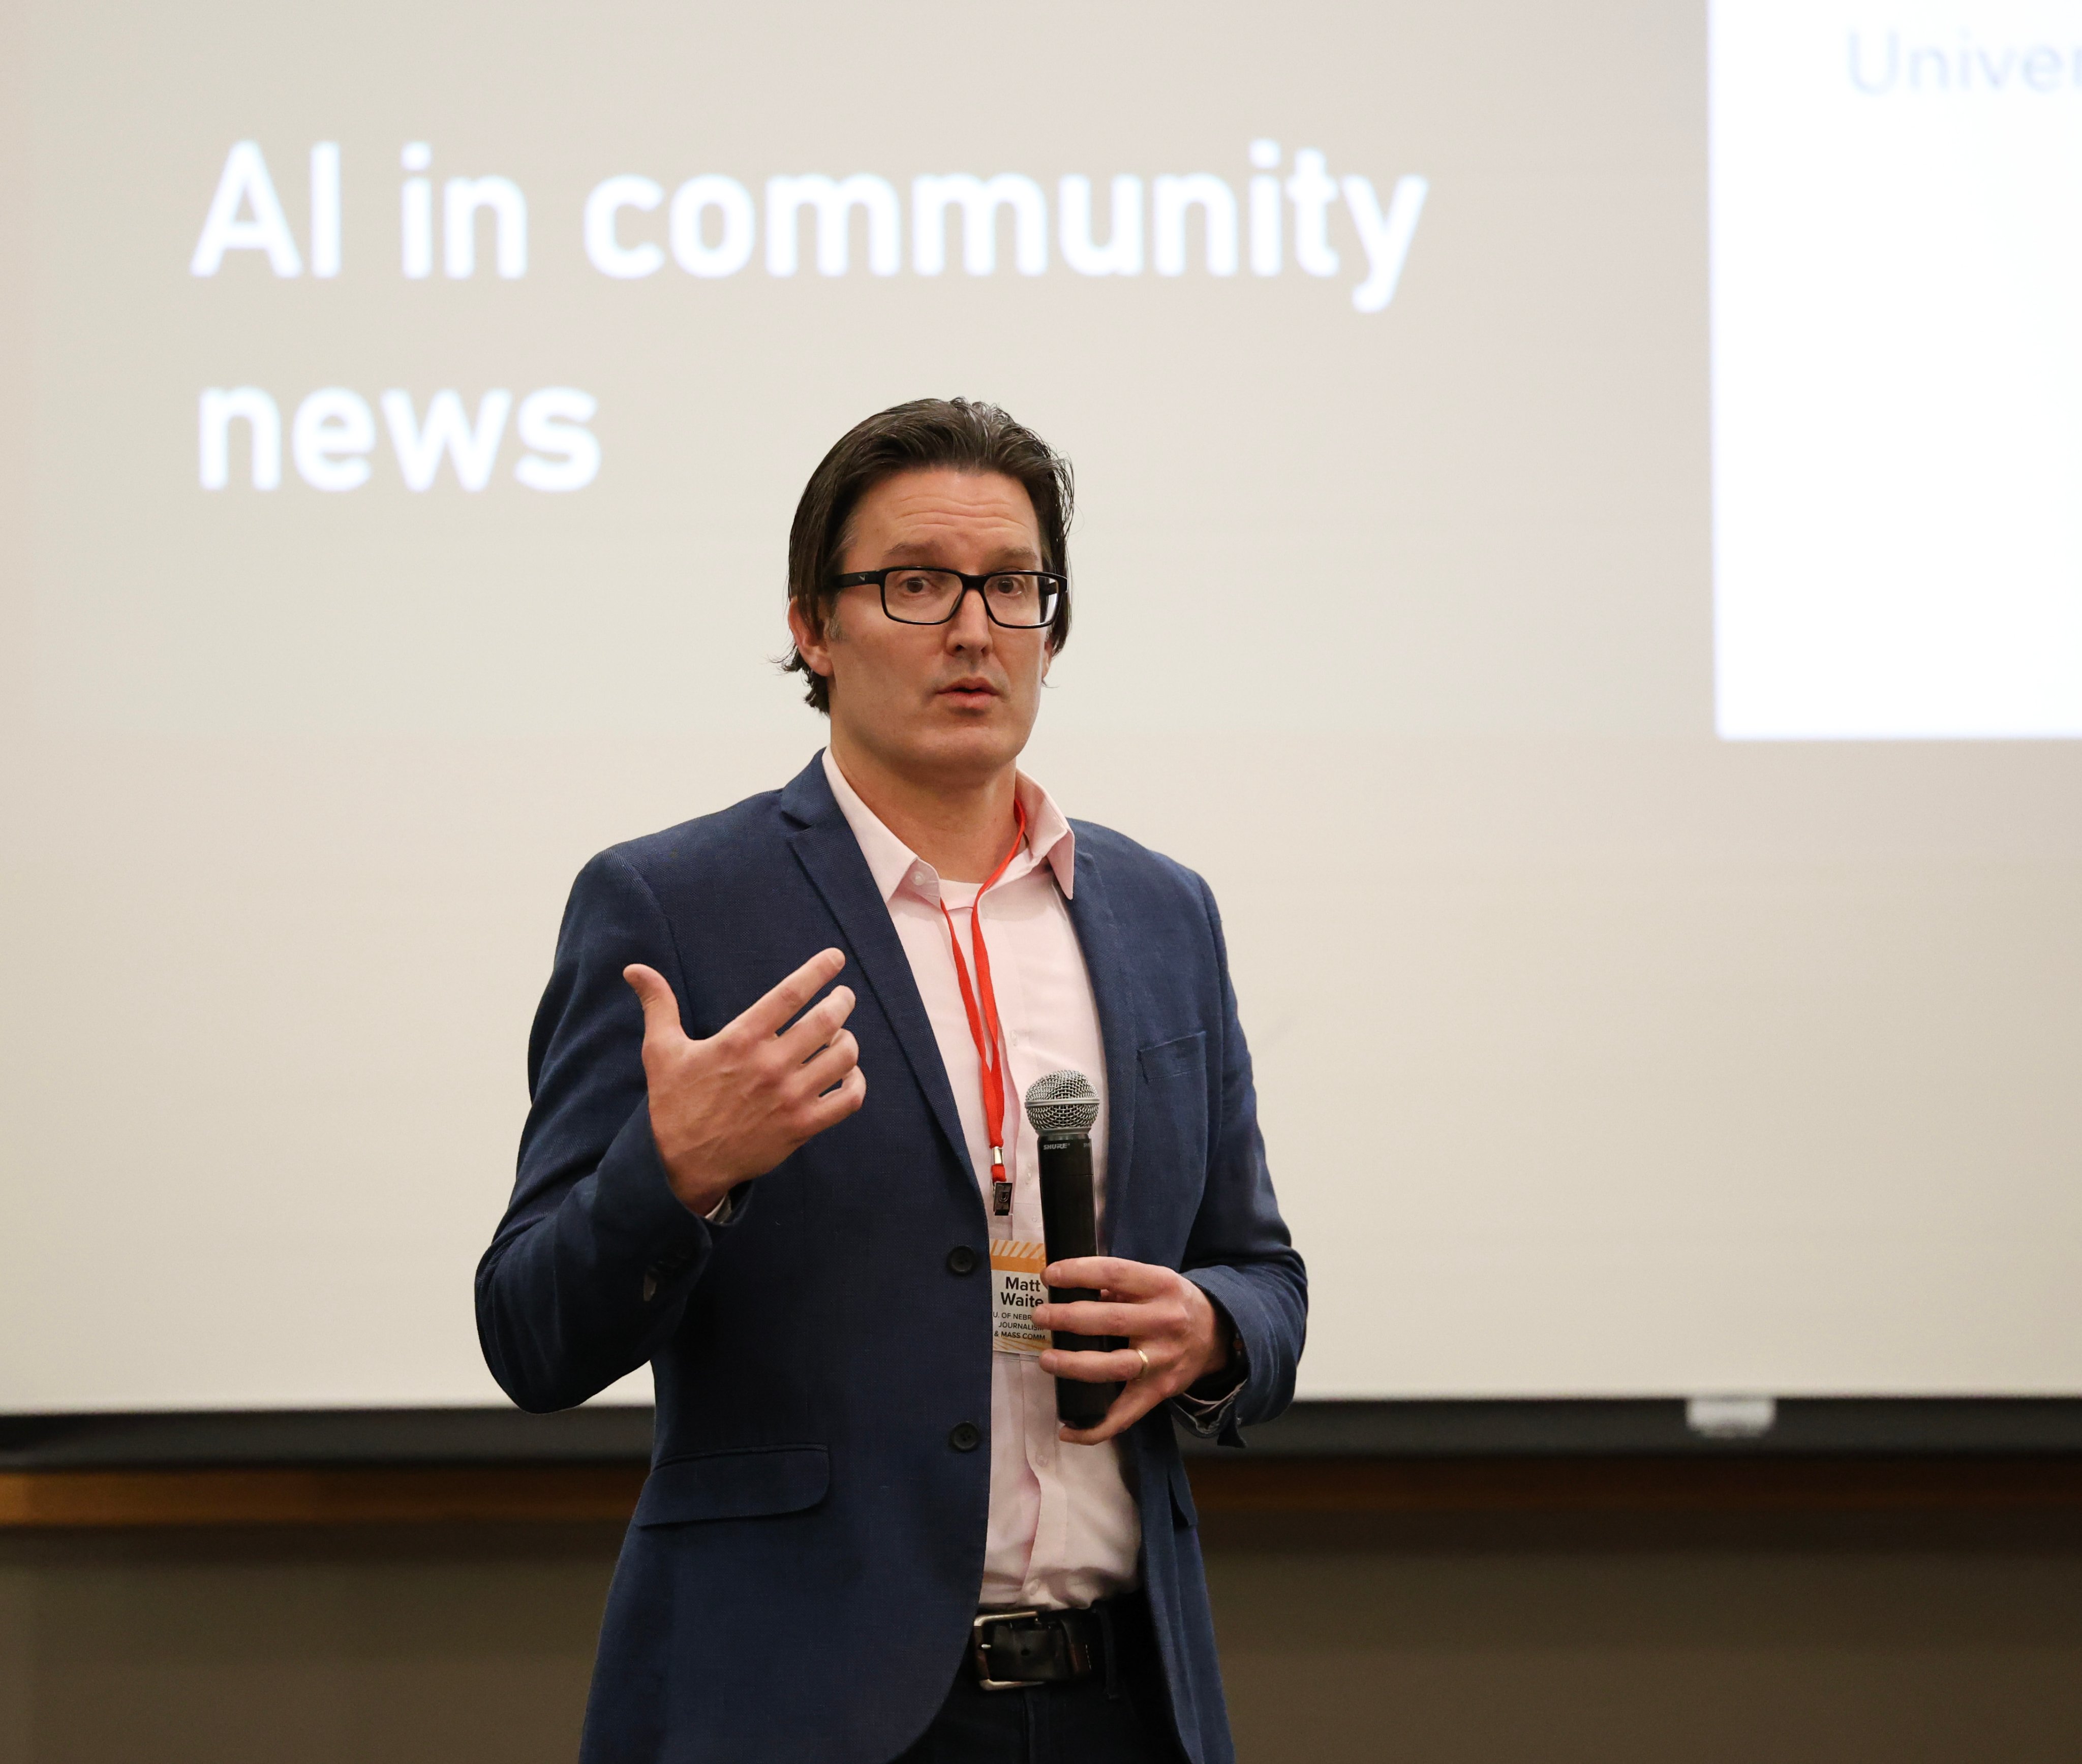
Matt Waite is a professor of practice in the College of Journalism and Mass Communications at the University of Nebraska-Lincoln who teaches courses in AI, data analysis and visualization. He regularly speaks on and consults media organizations about the legal, ethical and journalistic complexities of using drones, data and technology. From 2007-2011, he was a programmer/journalist for the St. Petersburg Times where he developed the website PolitiFact, winner of the 2009 Pulitzer Prize for national reporting. Before that, he was an award-winning investigative reporter and co-author of Paving Paradise: Florida’s Vanishing Wetlands and the Failure of No Net Loss.
About the tutorials
These tutorials have been developed in the classroom, semester over semester, as part of the University of Nebraska-Lincoln’s College of Journalism and Mass Communications’ JOUR 307 Data Journalism course. The current version, with the localization and this site, were created as part of a faculty development leave in Fall 2024.