Data &
Datasets
All data used throughout The Art of Data Journalism is open-source and drawn from authoritative government and journalistic sources. Each dataset is automatically localized to your state — so the examples you work with reflect real news in your community.
How the Data Works
Data loads automatically when you run the tutorials — no manual downloads required.
- check_circle Each tutorial fetches state-specific CSV files from this site
- check_circle Set your state once in your R environment, all tutorials update automatically
- check_circle Data is reproducible — same CSV files, version-stable
-
check_circle
CSVs are also available for direct download from
tutorial-data/
# Set your state in .Renviron (one-time setup)
tutorial.state = "NE"
# The tutorials handle data loading automatically
# Just open a tutorial and start learning
The Datasets
Census Population Estimates
County-level population estimates from the U.S. Census Bureau. One of the most fundamental datasets in data journalism — used in the first lessons to learn the basics of R and data frames.
Source: U.S. Census Bureau
USDA Rural Development Investments
Federal investment data for rural communities across the country, covering 2012–2024. Used in the bar chart visualization lessons.
Source: USDA
NTSB Airplane Crash Data
Five years of aviation accident investigations from the National Transportation Safety Board. Used in data cleaning lessons.
Source: NTSB
College Scorecard
U.S. Department of Education data on college costs, outcomes, and debt. This is the big one — 390MB and over 3,000 columns. Used to teach data selection and filtering at scale.
Source: U.S. Department of Education · 390MB · 3,000+ columns
View Source open_in_newSmall Area Health Insurance Estimates
County-level health insurance coverage estimates from the U.S. Census Bureau's SAHIE program. Used for exercises on joins and data relationships.
Source: U.S. Census Bureau (SAHIE)
EPA Greenhouse Gas Reporting
Facility-level greenhouse gas emissions from the EPA's GHGRP program (2023). Covers thousands of large industrial sources and power plants.
Source: U.S. Environmental Protection Agency · 2023
State Legislative Partisanship
NCSL data on partisan composition of all 50 state legislatures. Great for visualizing political trends.
Source: National Conference of State Legislatures
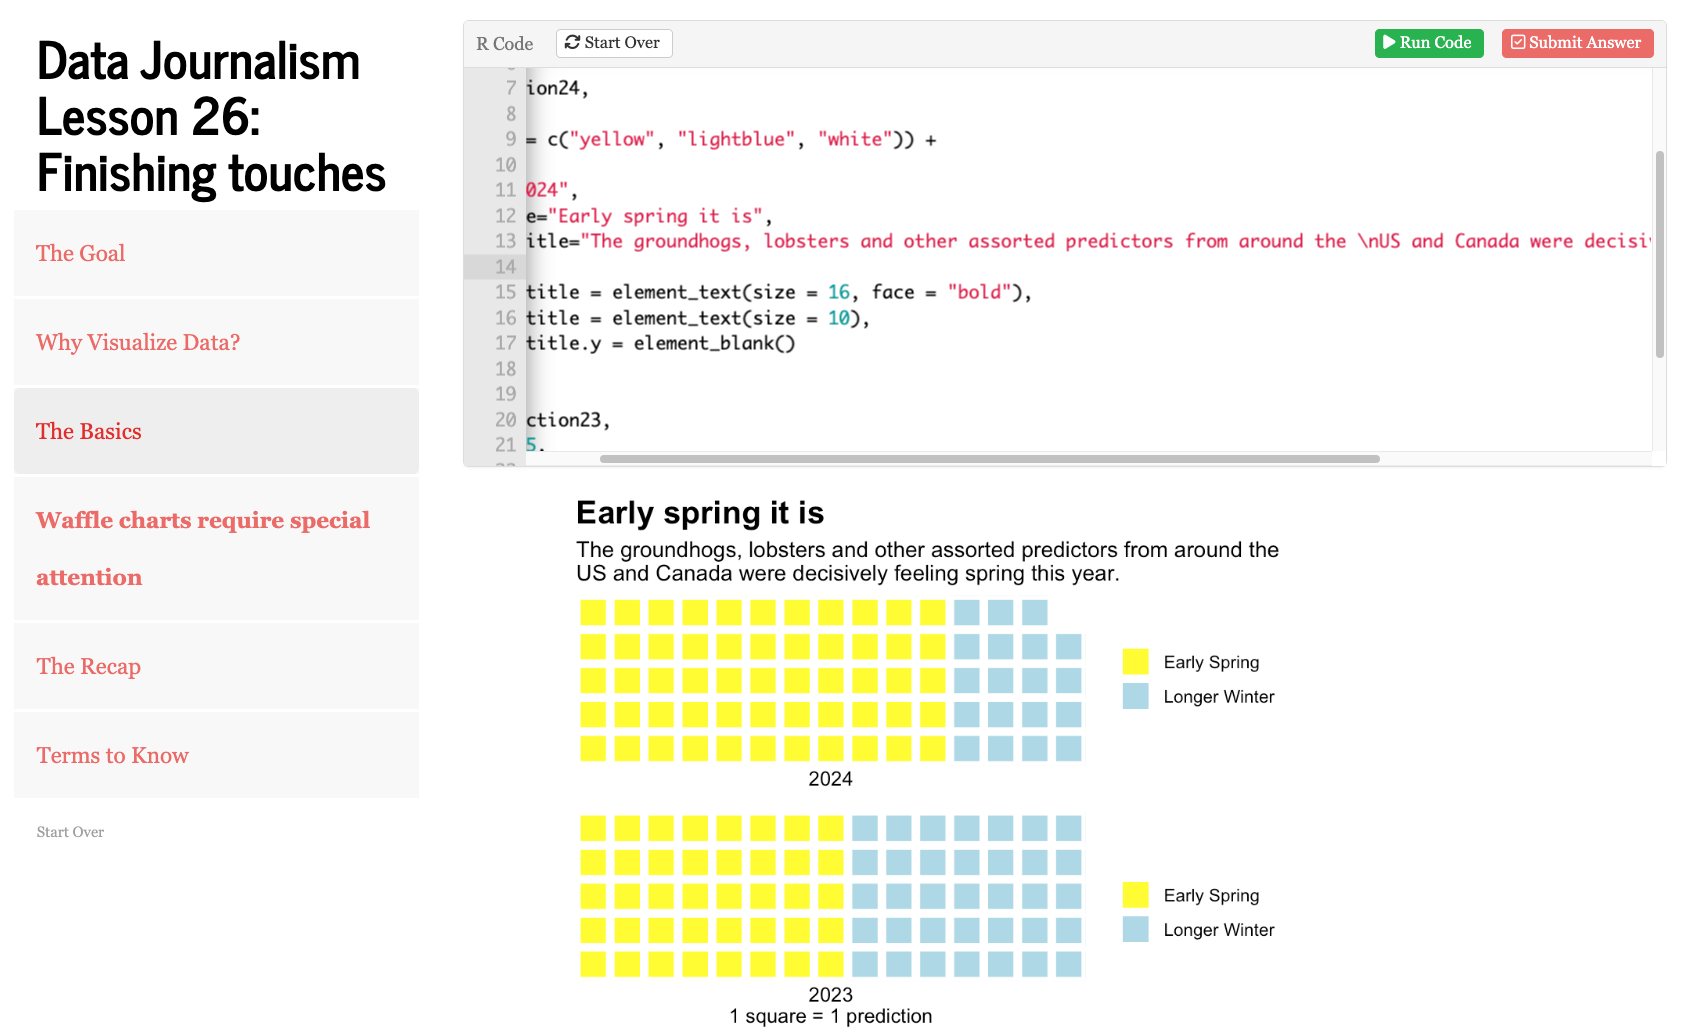
Groundhog Day Predictions
Every official groundhog prediction ever recorded, from groundhog-day.com. How accurate are they, really? One of the more whimsical datasets in the course — and a surprisingly good vehicle for teaching aggregation and visualization.
Source: groundhog-day.com
Six More Weeks?
50-State Coverage
Every dataset is prepared for all 50 states. Set your state code in .Renviron and the tutorials automatically load your state's data.
Open Sources
All data comes from authoritative public sources — government agencies, peer-reviewed databases, and recognized journalistic sources. Every dataset includes its provenance.
Reproducible
The same CSV files power every tutorial. Data is version-stable so your results are reproducible. Found an error? Open an issue on GitHub.